Happy Halloween!
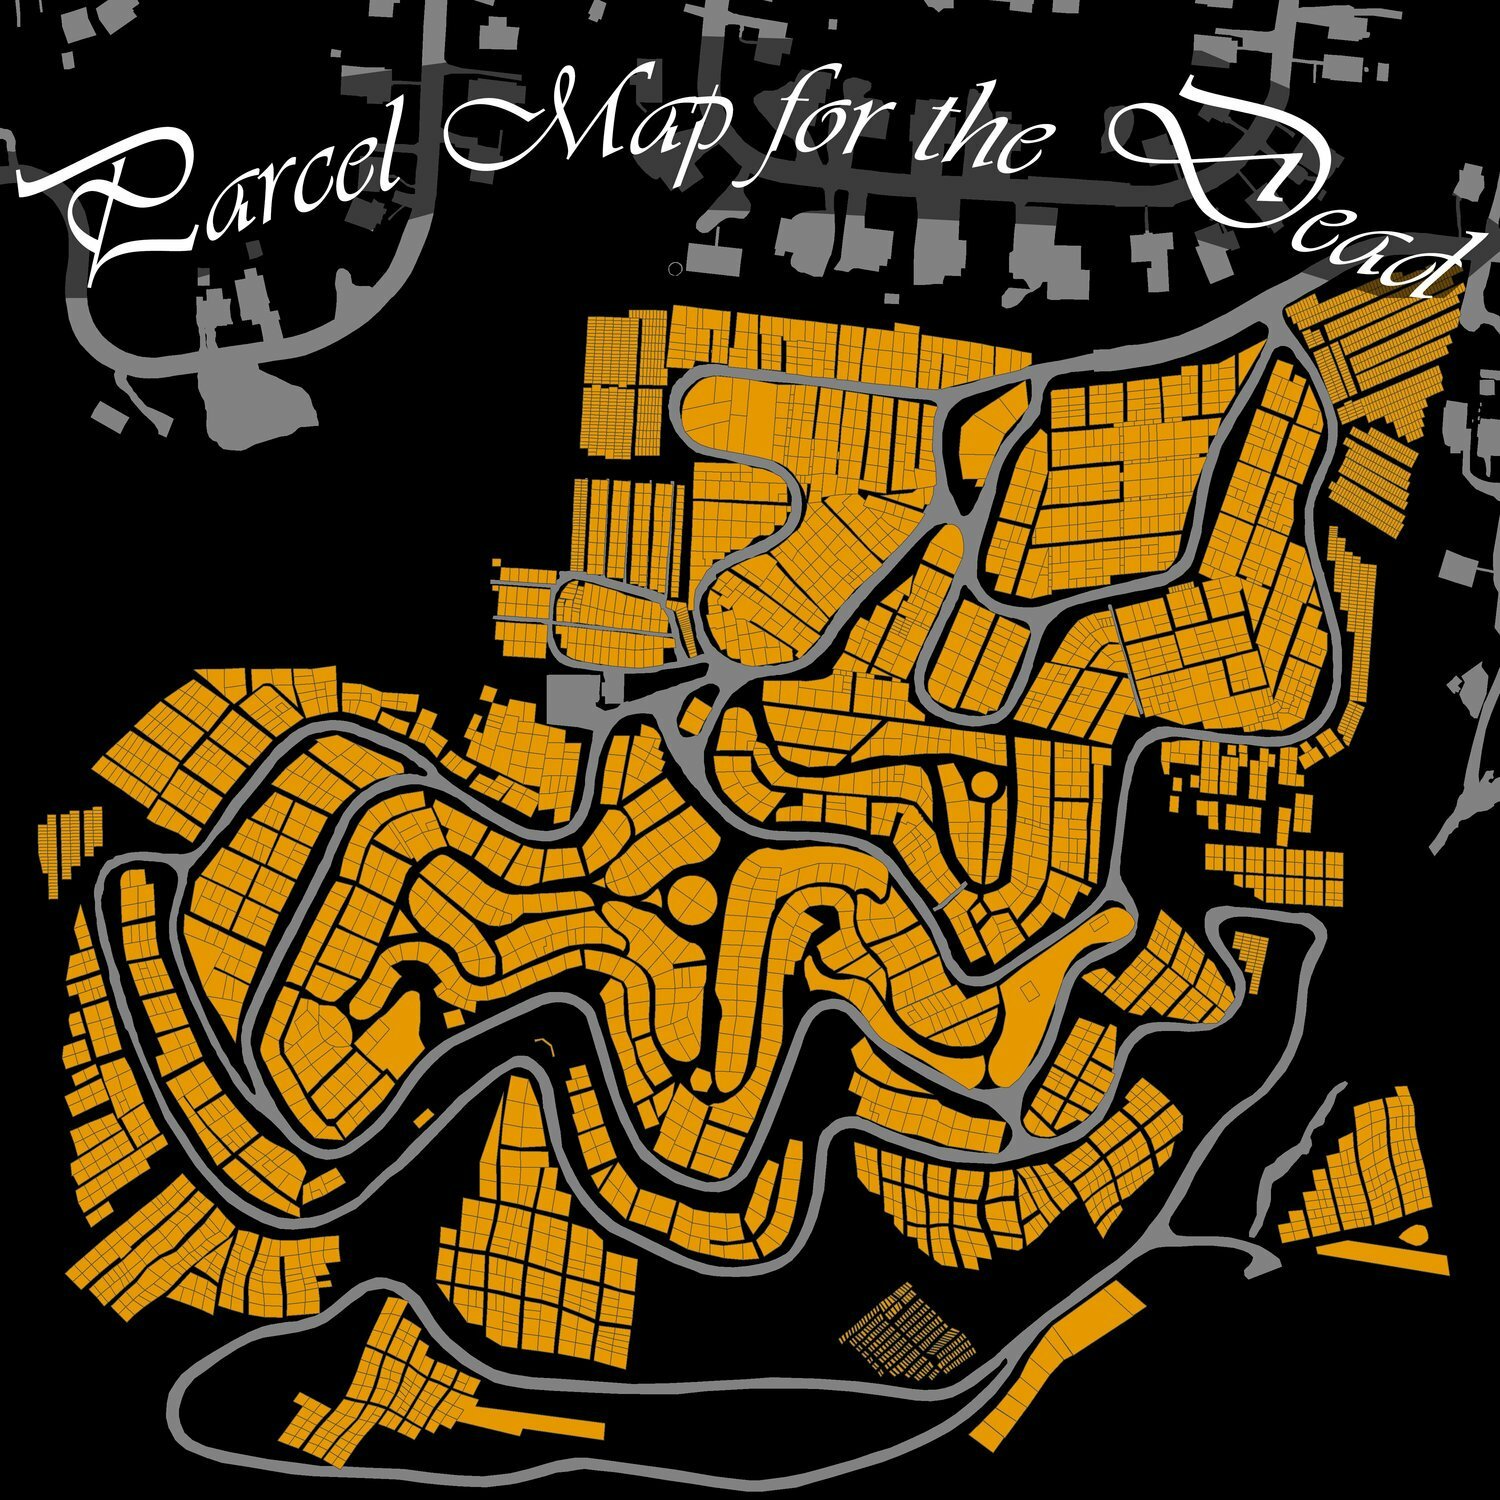
I made this map using a different kind of parcel data from the City of Asheville Open Data Portal. Instead of the taxable parcels we’re used to mapping these are the plots for Riverside Cemetery in Asheville, resting place of Thomas Wolfe. The space and use needs of a cemetery lend their layout some similarities to residential neighborhoods. Of course, on a much smaller scale…
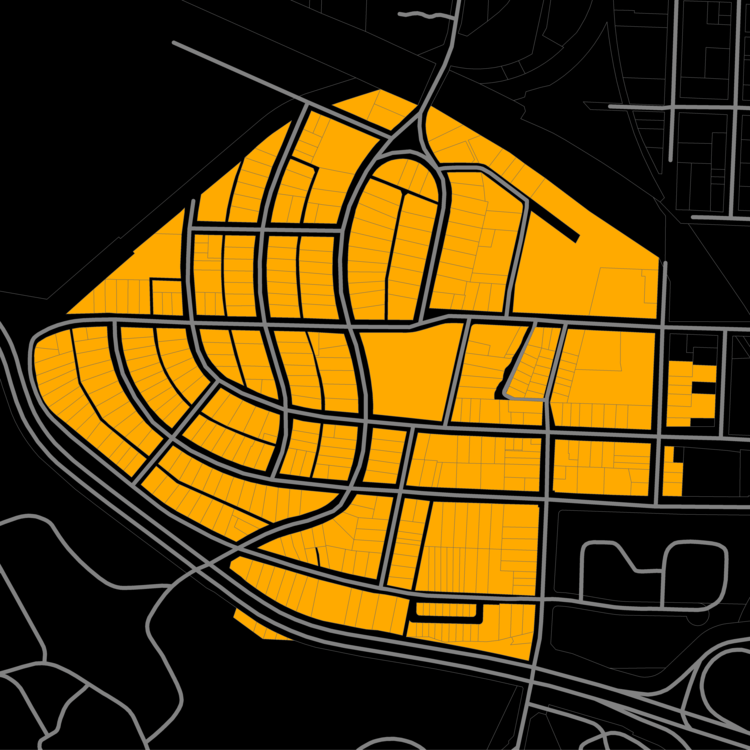
Riverside, in particular, could almost pass for a residential neighborhood designed around that same period, such as Boylan Heights in Raleigh. Designers started experimenting with curves and bends in the grid system to create an environment somewhere between a city grid and a park. In other words, a spookier more romantic version of the grid: the nested grid.
If Riverside Cemetery is the bucolic street-car suburb of the dead, then what would a NYC tenement for the dead look like…
Population Density For the Dead
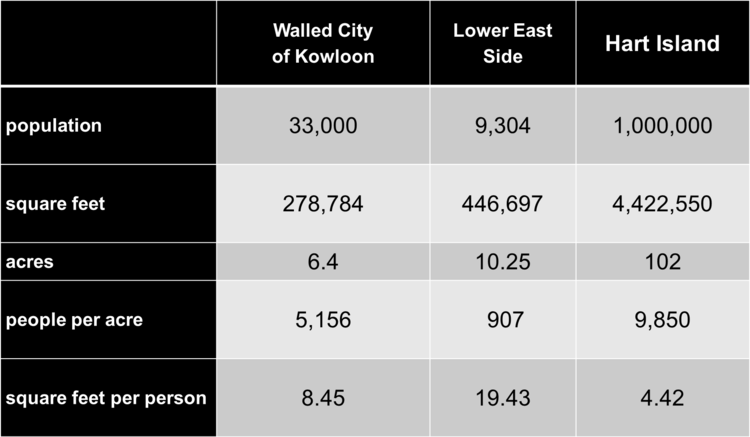
It turns out if you don’t have to accommodate all of a living person’s pesky needs (like bathrooms, food, water, air, and parking) you can fit a whole lot of them on one island. The NY Times ran this article on overlooked Hart Island. Hart Island has served as a cemetery in some capacity since the civil war and as New York City’s potter’s field. At this point it has a population over one million (all deceased).
For the sake of comparison, here’s the “population density” of Hart Island against two of the most packed neighborhoods in the world: The Walled City of Kowloon at its peak and the densest part of the Lower East Side in 1910. Which is more surprising? That The Walled City was so much denser than the Lower East Side or that it was only half as dense as a city full of dead people?
Happy Halloween!